

Question: Use the FDR method to correct for multiple comparisons using an FDR = .05. Which SNPs show statistically significant effects? How do the results compare
Use the FDR method to correct for multiple comparisons using an FDR = .05. Which SNPs show statistically significant effects? How do the results compare with those in Problem 12.72?
Genetics, Diabetes
Suppose we have separately analyzed the effects of 10 SNPs comparing people with type I diabetes vs. controls. The p-values from these separate analyses are given in Table 12.44.
Table 12.44: Effects of 10 SNPs on type I diabetes
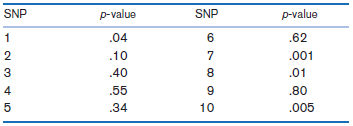
p-value p-value SNP SNP .04 .10 .40 .55 .34 .62 .001 .01 4 .80 .005 10
Step by Step Solution
3.37 Rating (150 Votes )
There are 3 Steps involved in it
We first reorder the SNPs by size of the nominal pvalue as shown below We no... View full answer

Get step-by-step solutions from verified subject matter experts
Document Format (2 attachments)
1427_6054778a54d57_660171.pdf
180 KBs PDF File
1427_6054778a54d57_660171.docx
120 KBs Word File