

Among the sample, the information for three particular likely voters is given here: (i) Likely voter 1
Question:
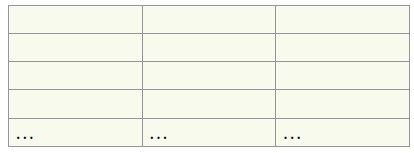
(i) Likely voter 1 reported spending 0 minutes in the last week learning/reading about local politics and likely voting for the incumbent.
(ii) Likely voter 2 reported spending 0 minutes in the last week learning/reading about local politics and likely voting for the incumbent.
(iii) Likely voter 3 reported spending 60 minutes in the last week learning/reading about local politics and likely voting for the challenger (not the incumbent).
Use this information to fill in the blank data table below, where the last row (€¦) indicates that additional information is present in the real data table since there were actually 267 likely voters in the survey. Be sure to provide appropriate labels/headings for the columns.
In order to estimate the proportion of all likely voters who will likely vote for the incumbent in the upcoming city€™s mayoral race, a random sample of 267 likely voters is taken, finding that 65% state they will likely vote for the incumbent.
Fantastic news! We've Found the answer you've been seeking!
Step by Step Answer:
Voter 1 2 3 Time sp...View the full answer

Answered By
Sindu K
Though my interest was in fully in Civil Engineering field so I like to gain many knowledge and moreover that i would like to share as much as i can. Because I truly beleive only through sharing our knowledge means we can gain more than we learned. So as a tutor I would like to share my knowledge experience that I have gone through after my bachelor's degree and I love too share more extra details regarding subjects.
0 Reviews
10+ Question Solved
Related Book For 

Introduction To Statistical Investigations
ISBN: 9781118172148
1st Edition
Authors: Beth L.Chance, George W.Cobb, Allan J.Rossman Nathan Tintle, Todd Swanson Soma Roy
Question Posted:
