

Question: The historical returns for two investmentsA and Bare summarized in the following table for the period 2016 to 2020. Use the data to answer the
The historical returns for two investments—A and B—are summarized in the following table for the period 2016 to 2020. Use the data to answer the questions that follow.
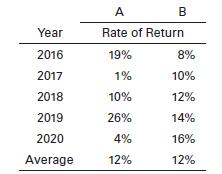
a. On the basis of a review of the return data, which investment appears to be more risky? Why?
b. Calculate the standard deviation for each investment’s returns.
c. On the basis of your calculations in part b, which investment is more risky?
Compare this conclusion to your observation in part a.
Year 2016 2017 2018 2019 2020 Average A Rate of Return 19% 1% 10% 26% 4% 12% B 8% 10% 12% 14% 16% 12%
Step by Step Solution
3.37 Rating (166 Votes )
There are 3 Steps involved in it
a Investment A with returns that vary widelyfrom 1 to 26appears to b... View full answer

Get step-by-step solutions from verified subject matter experts