

A major airline surveys passengers to monitor the satisfaction level of its customers. Even though the airline
Question:
A major airline surveys passengers to monitor the satisfaction level of its customers. Even though the airline uses a five-point Likert scale (5: outstanding service; 4: good; 3: average; 2: below average; 1: poor), it wants to monitor the proportion that considers the service level as either outstanding or good. Table 8-38 shows the number of passengers responding to the survey and the number that considers the service as either outstanding or good. Construct an appropriate control chart and comment on the service level of the airline.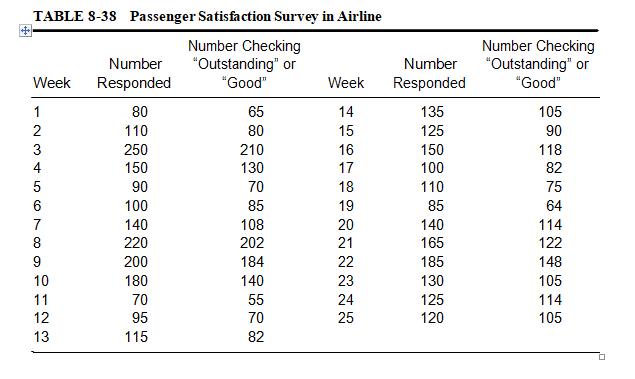
Fantastic news! We've Found the answer you've been seeking!
Step by Step Answer:
To construct a control chart to monitor the proportion of passengers that consider the airline service as either outstanding or good we need to calcul...View the full answer

Answered By
User l_917591
As a Business Management graduate from Moi University, I had the opportunity to work as a tutor for undergraduate students in the same field. This experience allowed me to apply the theoretical knowledge I had gained in a practical setting, while also honing my teaching and communication skills.
As a tutor, I was responsible for conducting tutorial sessions, grading assignments and exams, and providing feedback and support to my students. I also assisted with the preparation of course materials and collaborated with other tutors and professors to ensure consistency in teaching and assessment.
0 Reviews
10+ Question Solved
Related Book For 

Fundamentals Of Quality Control And Improvement
ISBN: 9781118705148
4th Edition
Authors: Amitava Mitra
Question Posted:
