

For the patient data in Exercise 7-52 as shown in Table 7-32, construct a risk-adjusted exponentially weighted
Question:
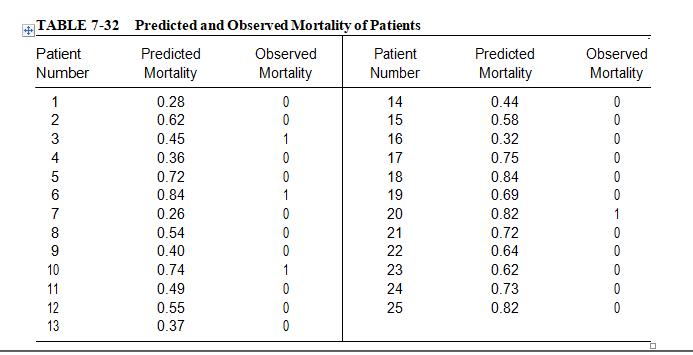
For the patient data in Exercise 7-52 as shown in Table 7-32, construct a risk-adjusted exponentially weighted moving average (RAEWMA) chart using a weighting constant of 0.2 and a false-alarm rate of 0.10. Comment on the performance of the surgical team.
Exercise 7-52
The predicted mortality of cardiac surgery patients in an intensive care unit, based on their APACHE score, is found based on a logistic regression model applied to patients over a four-year period. Table 7-32 shows the predictive pre-operative mortality for 25 recent patients, along with the observed outcome after surgery, where a value of 0 indicates that the patient survived while a value of 1 indicates that the patient died. Construct a risk-adjusted cumulative sum chart for patient mortality to determine if there has been an improvement. (Use the odds ratio under the alternative hypothesis to be Ra = 0.6.) Comment on the performance of the surgical team.
Step by Step Answer:
The RiskAdjusted Exponentially Weighted Moving Average RAEWMA chart is a statistical process control ...View the full answer


Fundamentals Of Quality Control And Improvement
ISBN: 9781118705148
4th Edition
Authors: Amitava Mitra
