

The following data represent the number of hurricanes in the Atlantic Ocean for the years 2000 to
Question:
The following data represent the number of hurricanes in the Atlantic Ocean for the years 2000 to 2017.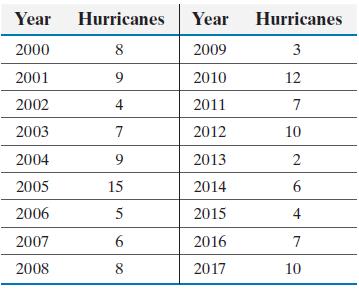
(a) Construct a time-series plot of the data.
(b) See Problem 37(b). What was percentage change from 2015 to 2016? What was the percentage change from 2016 to 2017?
Fantastic news! We've Found the answer you've been seeking!
Step by Step Answer:
a b Ycar 2000 2001 2002 2003 20...View the full answer

Answered By
Jeff Omollo
As an educator I have had the opportunity to work with students of all ages and backgrounds. Throughout my career, I have developed a teaching style that encourages student engagement and promotes active learning. My education and tutoring skills has enabled me to empower students to become lifelong learners.
5+ Reviews
42+ Question Solved
Related Book For 

Question Posted:
