

The following relative frequency histogram represents the proportion of employed people aged 1574 years old who are
Question:
The following relative frequency histogram represents the proportion of employed people aged 15–74 years old who are members of a union.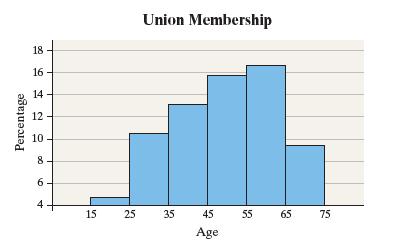
(a) Describe how this graph is misleading. What might a reader conclude from the graph?
(b) Redraw the histogram so that it is not misleading.
Fantastic news! We've Found the answer you've been seeking!
Step by Step Answer:
a The vertical axis starts at 4 instead of 0 This may lead ...View the full answer

Answered By
Joemar Canciller
I teach mathematics to students because I love to share what I have in this field.
I also want to see the students to love math and be fearless in this field.
I've been tutoring these past 2 years and I would like to continue what I've been doing.
1+ Reviews
10+ Question Solved
Related Book For 

Question Posted:
