

Sketch a titration curve (pH versus mL of titrant) for each of the following hypothetical weak bases
Question:
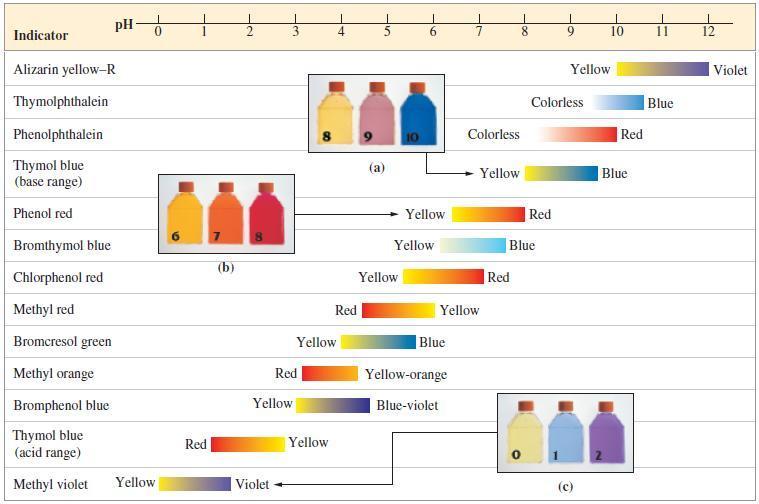
Sketch a titration curve (pH versus mL of titrant) for each of the following hypothetical weak bases when titrated with 0.100 M HCl. (Think of these bases as involving the substitution of organic groups, R, for one of the H atoms of NH3.) Select suitable indicators for the titrations from Figure 17-7.
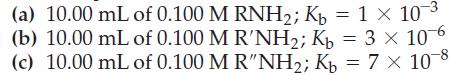
Figure 17-7
Step by Step Answer:

This question has not been answered yet.
You can Ask your question!
Related Book For 
General Chemistry Principles And Modern Applications
ISBN: 9780132931281
11th Edition
Authors: Ralph Petrucci, Jeffry Madura, F. Herring, Carey Bissonnette
Question Posted:
