

The graph below, which is related to a titration curve, shows the fraction () of the stoichiometric
Question:
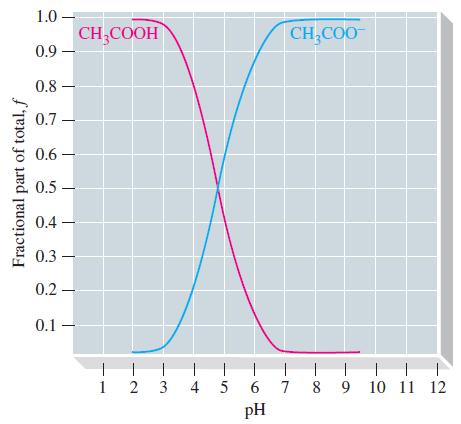
The graph below, which is related to a titration curve, shows the fraction (ƒ) of the stoichiometric amount of acetic acid present as non-ionized CH3COOH and as acetate ion, CH3COO-, as a function of the pH of the solution containing these species.
(a) Explain the significance of the point at which the two curves cross. What are the fractions and the pH at that point?
(b) Sketch a comparable set of curves for carbonic acid, H2CO3. How many carbonate-containing species should appear in the graph? How many points of intersection should there be? at what pH values?
(c) Sketch a comparable set of curves for phosphoric acid, H3PO4. How many phosphate-containing species should appear in the graph? How many points of intersection should there be? at what pH values?
Step by Step Answer:

This question has not been answered yet.
You can Ask your question!

General Chemistry Principles And Modern Applications
ISBN: 9780132931281
11th Edition
Authors: Ralph Petrucci, Jeffry Madura, F. Herring, Carey Bissonnette
