

Question: In the deconvolution example shown in Figure 5.29, the predicted signal shown in panel ((mathrm{C})) is much longer than the airgun signal in panel (B).
In the deconvolution example shown in Figure 5.29, the predicted signal shown in panel \((\mathrm{C})\) is much longer than the airgun signal in panel (B). Explain the origin of the long tails of the predicted signal.
Figure 5.29
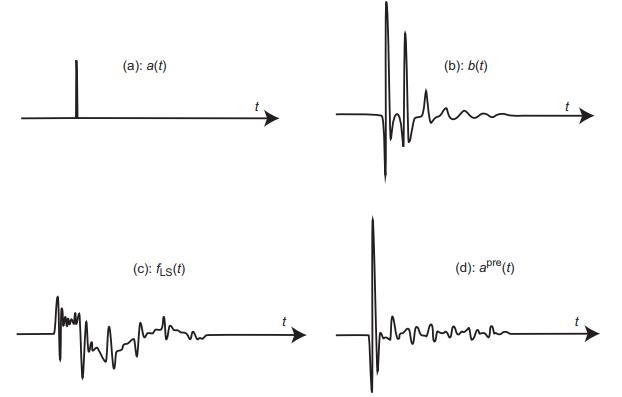
(): a(t) (b): b(t) (): fs(t) (d): apre (t)
Step by Step Solution
★★★★★
3.40 Rating (156 Votes )
There are 3 Steps involved in it
1 Expert Approved Answer
Step: 1 Unlock

Question Has Been Solved by an Expert!
Get step-by-step solutions from verified subject matter experts
Step: 2 Unlock
Step: 3 Unlock