

Reconsider Prob. 496. Using EES (or other) software, plot the soil temperature as a function of the
Question:
Reconsider Prob. 4–96. Using EES (or other) software, plot the soil temperature as a function of the distance from the earth’s surface as the distance varies from 0 m to 1m, and discuss the results.
Data From Problem 96
The soil temperature in the upper layers of the earth varies with the variations in the atmospheric conditions. Before a cold front moves in, the earth at a location is initially at a uniform temperature of 10°C. Then the area is subjected to a temperature of 210°C and high winds that resulted in a convection heat transfer coefficient of 40 W/m2 · K on the earth’s surface for a period of 10 h. Taking the properties of the soil at that location to be k = 0.9 W/m · K and a = 1.6 × 10⁻⁵ m2/s, determine the soil temperature at distances 0, 10, 20, and 50 cm from the earth’s surface at the end of this 10-h period.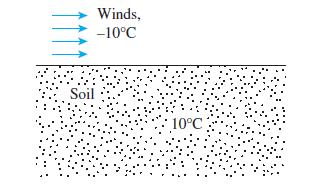
Step by Step Answer:

This question has not been answered yet.
You can Ask your question!

Heat And Mass Transfer Fundamentals And Applications
ISBN: 9780073398181
5th Edition
Authors: Yunus Cengel, Afshin Ghajar
