

An ROC curve plots the false positive rate (x-axis) against the true positive rate (y-axis) for different
Question:
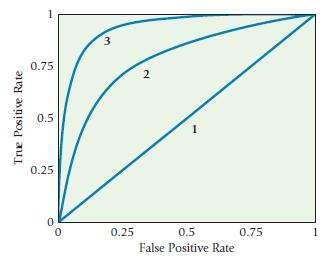
An ROC curve plots the false positive rate (x-axis) against the true positive rate (y-axis) for different model thresholds. The graph below shows three different ROC curves labeled 1, 2, and 3.
Required
1. Compare the curves labeled 1, 2, and 3 in the chart above. Which curve represents the model that would be most useful for a management accountant? Explain.
2. Explain what a “straight line” ROC curve actually represents.
Fantastic news! We've Found the answer you've been seeking!
Step by Step Answer:
1 Comparing the curves labeled 1 2 and 3 in the chart above the curve that would be most useful for ...View the full answer

Answered By
User l_917591
As a Business Management graduate from Moi University, I had the opportunity to work as a tutor for undergraduate students in the same field. This experience allowed me to apply the theoretical knowledge I had gained in a practical setting, while also honing my teaching and communication skills.
As a tutor, I was responsible for conducting tutorial sessions, grading assignments and exams, and providing feedback and support to my students. I also assisted with the preparation of course materials and collaborated with other tutors and professors to ensure consistency in teaching and assessment.
0 Reviews
10+ Question Solved
Related Book For 
Horngrens Cost Accounting A Managerial Emphasis
ISBN: 9780135628478
17th Edition
Authors: Srikant M. Datar, Madhav V. Rajan
Question Posted:
