

Question: Tracking hurricanes 2018 In Chapter 6, we saw data on the errors (in nautical miles) made by the National Hurricane Center in predicting the path
Tracking hurricanes 2018 In Chapter 6, we saw data on the errors (in nautical miles) made by the National Hurricane Center in predicting the path of hurricanes. The scatterplot below shows the trend in the 24-hour tracking errors from 1970 to 2018 (www.nhc.noaa.gov).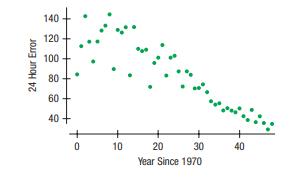
a) Interpret the slope and intercept of the model.
b) Interpret se in this context.
c) The Center wanted to achieve an average tracking error of 9 nautical miles by 2030. Do you think they’ll make it?
Defend your response.
d) What if their goal had been an average tracking error of 3 nautical miles?
e) What cautions would you state about your conclusion?
24 Hour Error 140 120 100 80 60 40 0 10 20 30 40 Year Since 1970
Step by Step Solution
There are 3 Steps involved in it

Get step-by-step solutions from verified subject matter experts