

Question: Tracking hurricanes 2012 In a previous chapter, we saw data on the errors (in nautical miles) made by the National Hurricane Center in predicting the
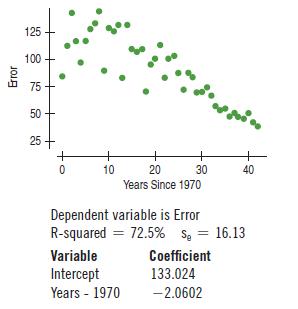
Tracking hurricanes 2012 In a previous chapter, we saw data on the errors (in nautical miles) made by the National Hurricane Center in predicting the path of hurricanes. The scatterplot at the top of the next page shows the trend in the 24-hour tracking errors since 1970
(www.nhc.noaa.gov).
a) Interpret the slope and intercept of the model.
b) Interpret se in this context.
c) The Center would like to achieve an average tracking error of 45 nautical miles by 2015. Will they make it?
Defend your response.
d) What if their goal were an average tracking error of 25 nautical miles?
e) What cautions would you state about your conclusion?
Error 125 100 75 50 50 25 0 10 20 30 40 Years Since 1970 Dependent variable is Error R-squared 72.5% S = 16.13 Variable Coefficient Intercept 133.024 Years 1970 -2.0602
Step by Step Solution
There are 3 Steps involved in it

Get step-by-step solutions from verified subject matter experts