

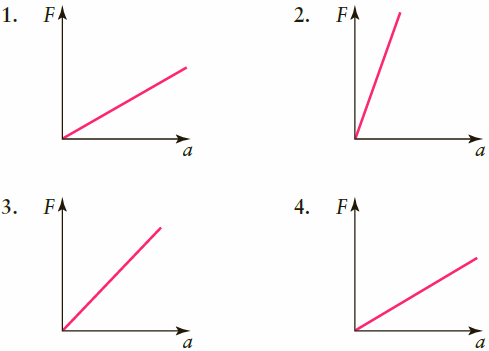
The graphs in Figure 2.52 show plots of force versus acceleration for several objects. Rank these displays
Question:
The graphs in Figure 2.52 show plots of force versus acceleration for several objects. Rank these displays using the identifying numbers according to the mass of the affected object from smallest to largest. If any objects share the same mass, give them the same ranking. For reference, the graphs all have the same scale for their respective F and a axes.
Explain your reasons for your rankings.
Fantastic news! We've Found the answer you've been seeking!
Step by Step Answer:
For this question we use Newtons second law F ma Because the slope of a fo...View the full answer

Answered By
Gilbert Chesire
I am a diligent writer who understands the writing conventions used in the industry and with the expertise to produce high quality papers at all times. I love to write plagiarism free work with which the grammar flows perfectly. I write both academics and articles with a lot of enthusiasm. I am always determined to put the interests of my customers before mine so as to build a cohesive environment where we can benefit from each other. I value all my clients and I pay them back by delivering the quality of work they yearn to get.
14+ Reviews
49+ Question Solved
Related Book For 
Question Posted:
