

Question: Prepare a horizontal, vertical, and ratio analysis for Nathan Corporation. Start your spreadsheet software and load the spreadsheet template file IA8 Spreadsheet 09-C.xlsx. Use formulas
Prepare a horizontal, vertical, and ratio analysis for Nathan Corporation. Start your spreadsheet software and load the spreadsheet template file IA8 Spreadsheet 09-C.xlsx. Use formulas to compute changes, percents, and ratios. Assume 30,000 shares of stock are outstanding and the market price per share was $30.
a.
b.
 c.
c.
d.
e.
Nathan Corporation
Ratio Analysis
For Year Ended 12/31/€“
Earnings Performance Analysis
Rate Earned on Average Total Assets
Rate Earned on Average Stockholders€™ Equity
Rate Earned on Net Sales
Earnings Per Share
Price-Earnings Ratio
Efficiency Analysis
Accounts Receivable Turnover Ratio
Average Days for Payment
Merchandise Inventory Turnover Ratio
Average Number of Days Sales in Merch. Inv.
Short-Term Financial Strength
Working Capital
Current Ratio
Acid-Test Ratio
Long-Term Financial Strength Analysis
Debt Ratio
Equity Ratio
Equity Per Share
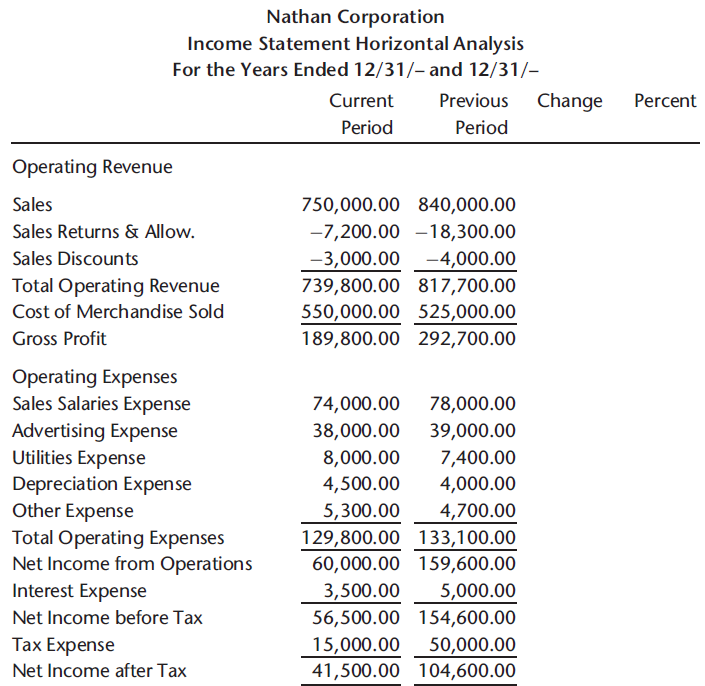
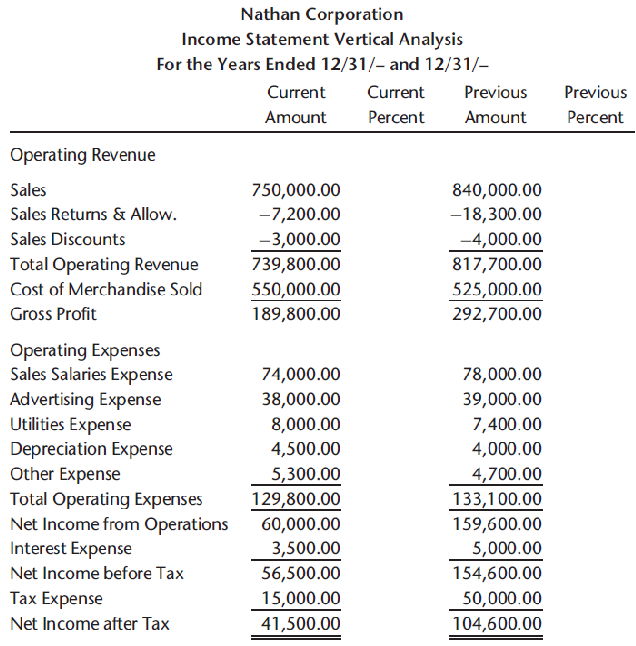
Nathan Corporation Income Statement Horizontal Analysis For the Years Ended 12/31/- and 12/31/ Current Previous Change Percent Period Period Operating Revenue Sales 750,000.00 840,000.00 Sales Returns & Allow. -7,200.00 -18,300.00 Sales Discounts -3,000.00-4,000.00 739,800.00 817,700.00 Total Operating Revenue Cost of Merchandise Sold 550,000.00 525,000.00 189,800.00 292,700.00 Gross Profit Operating Expenses Sales Salaries Expense 78,000.00 74,000.00 Advertising Expense Utilities Expense Depreciation Expense Other Expense 38,000.00 39,000.00 8,000.00 7,400.00 4,500.00 4,000.00 5,300.00 4,700.00 Total Operating Expenses Net Income from Operations Interest Expense 129,800.00 133,100.00 60,000.00 159,600.00 3,500.00 56,500.00 154,600.00 5,000.00 Net Income before Tax Tax Expense 15,000.00 50,000.00 Net Income after Tax 41,500.00 104,600.00 Nathan Corporation Income Statement Vertical Analysis For the Years Ended 12/31/- and 12/31/- Current Current Previous Previous Amount Percent Amount Percent Operating Revenue 750,000.00 -7,200.00 Sales 840,000.00 -18,300.00 Sales Returns & Allow. -4,000.00 817,700.00 Sales Discounts -3,000.00 Total Operating Revenue Cost of Merchandise Sold 739,800.00 550,000.00 525,000.00 Gross Profit 189,800.00 292,700.00 Operating Expenses Sales Salaries Expense Advertising Expense Utilities Expense Depreciation Expense 74,000.00 78,000.00 38,000.00 39,000.00 8,000.00 7,400.00 4,500.00 4,000.00 4,700.00 133,100.00 Other Expense 5,300.00 129,800.00 Total Operating Expenses Net Income from Operations Interest Expense 60,000.00 3,500.00 159,600.00 5,000.00 Net Income before Tax 56,500.00 154,600.00 Tax Expense 15,000.00 50,000.00 Net Income after Tax 41,500.00 104,600.00
Step by Step Solution
3.30 Rating (153 Votes )
There are 3 Steps involved in it
a Nathan Corporation Income Statement Horizontal Analysis For Years Ended 1231 and 1231 b Nathan Corporation Income Statement Vertical Analysis For th... View full answer

Get step-by-step solutions from verified subject matter experts