

Question: Build a Model: Ratio Analysis Start with the partial model in the file Ch07 P15 Build a Model.xlsx from the textbooks Web site. Joshua &
Build a Model: Ratio Analysis Start with the partial model in the file Ch07 P15 Build a Model.xlsx from the textbook’s Web site. Joshua & White (J&W) Technology’s financial statements are also shown here. Answer the following questions.
b. Has J&W’s liquidity position improved or worsened? Explain.
c. Has J&W’s ability to manage its assets improved or worsened? Explain.
d. How has J&W’s profitability changed during the last year?
e. Perform an extended DuPont analysis for J&W for 2020 and 2021. What do these results tell you?
f. Perform a common size analysis. What has happened to the composition (that is, percentage in each category) of assets and liabilities?
g. Perform a percentage change analysis. What does this tell you about the change in profitability and asset utilization?
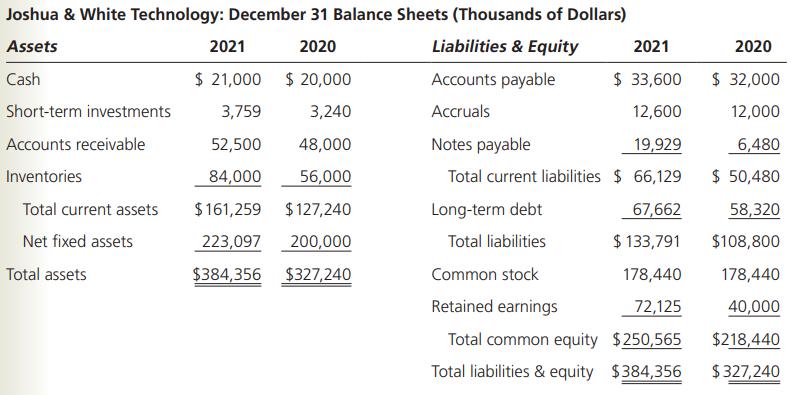
Joshua & White Technology: December 31 Balance Sheets (Thousands of Dollars) Assets 2021 2020 Liabilities & Equity Cash $ 21,000 $20,000 Short-term investments 3,759 3,240 Accounts receivable 52,500 48,000 Inventories 84,000 56,000 $161,259 $127,240 223,097 200,000 $384,356 $327,240 Total current assets Net fixed assets Total assets Accounts payable Accruals 2021 $ 33,600 12,600 Notes payable 19,929 Total current liabilities $ 66,129 67,662 $ 133,791 Long-term debt Total liabilities Common stock Retained earnings Total common equity $250,565 Total liabilities & equity $384,356 178,440 72,125 2020 $ 32,000 12,000 6,480 $ 50,480 58,320 $108,800 178,440 40,000 $218,440 $327,240
Step by Step Solution
3.48 Rating (171 Votes )
There are 3 Steps involved in it
b To determine if JWs liquidity position improved or worsened we can look at the current ratio and quick ratio The current ratio is calculated by dividing total current assets by total current liabili... View full answer

Get step-by-step solutions from verified subject matter experts