

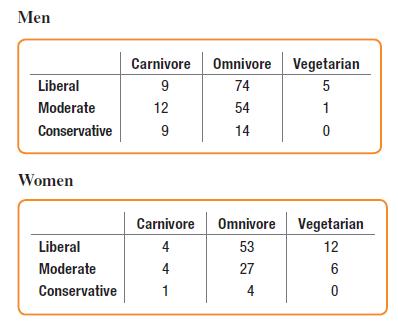
Question: Are the patterns seen in Exercises 5 and 6 relating diet to political opinion the same for men and women? Here are two contingency tables:
Are the patterns seen in Exercises 5 and 6 relating diet to political opinion the same for men and women? Here are two contingency tables:
Data From Exercise 5
The survey of 299 undergraduate students from Exercise 86 in Chapter 2 (data in Student Survey) asked about respondents’ diet preference (Carnivore, Omnivore, Vegetarian) and political alignment (Liberal, Moderate, Conservative). Here is a stacked bar chart of the 285 responses:
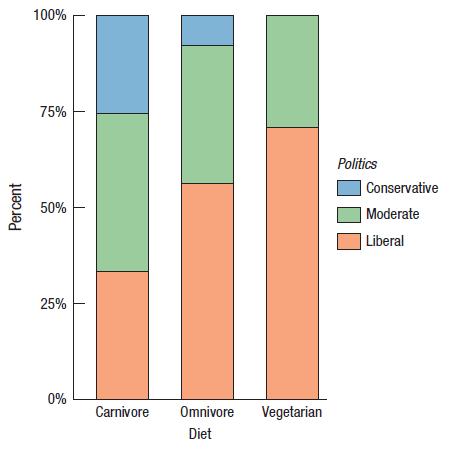
a) Describe what this plot shows using the concept of a conditional distribution.
b) Do you think the differences here are real? Explain.
Percent 100% 75% 50% 25% 0% Carnivore Omnivore Diet Vegetarian Politics Conservative Moderate Liberal
Step by Step Solution
3.45 Rating (161 Votes )
There are 3 Steps involved in it
a Men are more likely to be conservative carnivores 91... View full answer

Get step-by-step solutions from verified subject matter experts