

Question: The Centers for Disease Control and Prevention provide data on smoking rates by year and for men and women separately. Here is a table with
The Centers for Disease Control and Prevention provide data on smoking rates by year and for men and women separately. Here is a table with some of that information:
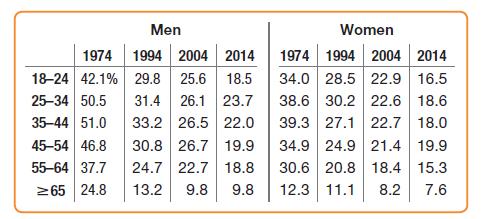
a) What was the smoking rate among 18–24-year-old men in 1974?
b) How has the smoking rate among 18–24-year-old men changed from 1974 to 2014?
c) Men who were 18–24 in 1974 were 20 years older—in the 35–44 group—in 1994, and so on diagonally across the table. How has the smoking rate in that cohort of men changed over the 30 years covered by these data?
Men Women 1974 1994 2004 2014 18-24 42.1% 29.8 25.6 18.5 1974 1994 2004 2014 34.0 28.5 22.9 16.5 38.6 30.2 22.6 18.6 25-34 50.5 31.4 26.1 23.7 35-44 51.0 33.2 26.5 22.0 45-54 46.8 30.8 26.7 19.9 39.3 27.1 22.7 18.0 34.9 24.9 21.4 19.9 18.4 55-64 37.7 24.7 22.7 18.8 30.6 20.8 15.3 65 24.8 13.2 9.8 9.8 12.3 11.1 8.2 7.6
Step by Step Solution
3.47 Rating (160 Votes )
There are 3 Steps involved in it
a The smoking rate for 1824yearold men was 421 in 1974 b ... View full answer

Get step-by-step solutions from verified subject matter experts