

Question: From Exercise 16 it appeared that the mean cost of a cappuccino was slightly higher than the mean cost of a dozen eggs. Given the
From Exercise 16 it appeared that the mean cost of a cappuccino was slightly higher than the mean cost of a dozen eggs. Given the variation among the prices, could that difference be due just to chance? To examine that further, we took 1000 random samples of 100 cities and computed the difference between the mean price of a cappuccino and a dozen eggs. The histogram below shows the 1000 mean differences.
a) If there were no real difference between the mean prices, where would you expect the center of the histogram to be?
b) Given the histogram, what do you conclude?
Data From Exercise 16
Here are the same three prices as in Exercise 15 but for 576 cities around the world.
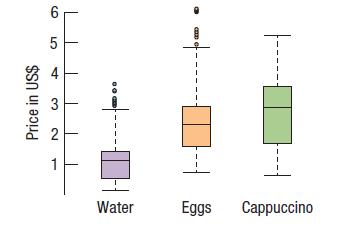
Price in US$ 6 5 2 1 Water can Eggs Cappuccino
Step by Step Solution
3.49 Rating (162 Votes )
There are 3 Steps involved in it
a If there were no mean difference we would expect the histogram ... View full answer

Get step-by-step solutions from verified subject matter experts