

Question: From Exercise 50 it appeared that the mean log fusion time for the VV group was greater than that of the NV group. Could the
From Exercise 50 it appeared that the mean log fusion time for the VV group was greater than that of the NV group. Could the difference be due to chance? The histogram below shows the difference in the means of the log fusion times by randomly selecting two groups (ignoring the group labels) 1000 times. The actual difference was smaller (in absolute value) than the randomly generated ones 16 times out of 1000. What do you conclude?
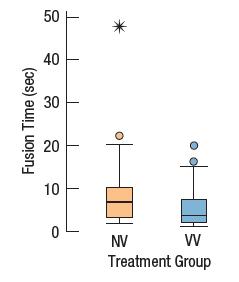
Data From Exercise 50
Because of the skewness of the distributions of fusion times described in Exercise 49, we might consider a re-expression. Here are the boxplots of the log of fusion times. Is it better to analyze the original fusion times or the log fusion times?
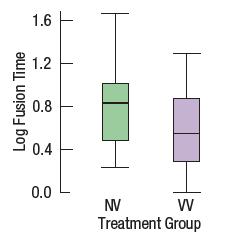
Data From Exercise 49
Stereograms appear to be composed entirely of random dots. However, they contain separate images that a viewer can “fuse” into a three-dimensional (3D) image by staring at the dots while defocusing the eyes. An experiment was performed to determine whether knowledge of the embedded image affected the time required for subjects to fuse the images.
One group of subjects (group NV) received no information or just verbal information about the shape of the embedded object. A second group (group VV) received both verbal information and visual information (specifically, a drawing of the object). The experimenters measured how many seconds it took for the subject to report that he or she saw the 3D image.
Log Fusion Time 1.6 1.2 0.8 0.4 0.0 NV W Treatment Group
Step by Step Solution
3.48 Rating (168 Votes )
There are 3 Steps involved in it
In 1000 random shufflings a difference as large as the one observ... View full answer

Get step-by-step solutions from verified subject matter experts