

Question: Here is a mosaic plot of the data on Fish consumption and Prostate cancer from the Step-by-Step Example on page 72. a) From the mosaic
Here is a mosaic plot of the data on Fish consumption and Prostate cancer from the Step-by-Step Example on page 72.
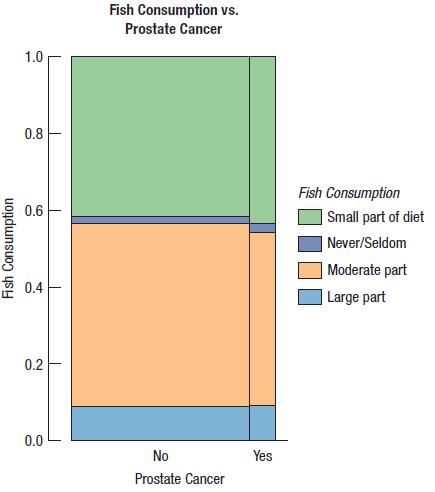
a) From the mosaic plot, about what percent of all men in this survey were diagnosed with prostate cancer?
b) Are there more men who had cancer and never/seldom ate fish, or more who didn’t have cancer and never/seldom ate fish?
c) Which is higher: the percent of men with cancer who never/ seldom ate fish, or the percent of men without cancer who never/seldom ate fish?
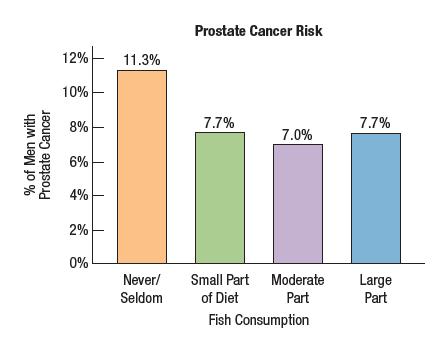
% of Men with Prostate Cancer 12% 10% 8% 6% 4% 2% 0% 11.3% Never/ Seldom Prostate Cancer Risk 7.7% Small Part of Diet 7.0% Moderate Part Fish Consumption 7.7% Large Part
Step by Step Solution
3.56 Rating (160 Votes )
There are 3 Steps involved in it
a Looking at the horizontal axis only approximately 7 of ... View full answer

Get step-by-step solutions from verified subject matter experts