

Question: Here is a mosaic plot of the data from Exercise 1 on whether college provides value from a survey of U.S. adults and college presidents:
Here is a mosaic plot of the data from Exercise 1 on whether college provides value from a survey of U.S. adults and college presidents:
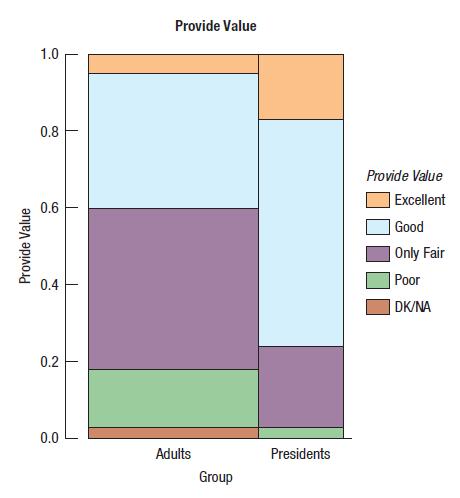
a) From the mosaic plot, about what percent of the respondents were college presidents?
b) From the mosaic plot, is it easy to see if there more U.S. adults who said college provides excellent value or more presidents who said college provides excellent value? Explain briefly.
c) From the mosaic plot, is it easy to see how the percentage of college presidents who said college provides excellent value compares with the percentage of all U.S. adults who said that? Explain briefly
d) From the mosaic plot, do you think that there is an association between the distribution of responses and whether the respondent is a college president? Explain briefly.
Provide Value 1.0 0.8 0.6 0.4 0.2 Provide Value Adults Group Presidents Provide Value Excellent Good Only Fair Poor DK/NA
Step by Step Solution
3.46 Rating (178 Votes )
There are 3 Steps involved in it
a Approximately 33 of the respondents were college presidents Look only at the horizontal axis to e... View full answer

Get step-by-step solutions from verified subject matter experts