

In Exercise 41, you investigated the federal rate on 3-month Treasury bills between 1950 and 1980. The
Question:
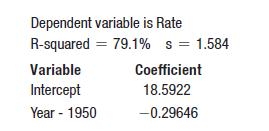
In Exercise 41, you investigated the federal rate on 3-month Treasury bills between 1950 and 1980. The scatterplot below shows that the trend changed dramatically after 1980, so we computed a new regression model for the years 1981 to 2015.
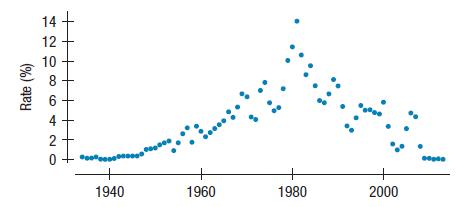
Here’s the model for the data from 1981 to 2015 (in years since 1950):
a) How does this model compare to the one in Exercise 41?
b) What does this model estimate the interest rate will be in 2020? How does this compare to the rate you predicted in Exercise 41?
c) Do you trust this newer predicted value?
d) Would you use either of these models to predict the TBill rate in the future?
Data From Exercise 41
Here are a plot and regression output showing the federal rate on 3-month Treasury bills from 1950 to 1980, and a regression model fit to the relationship between the Rate (in %) and Years Since 1950 (www.gpoaccess.gov/eop/).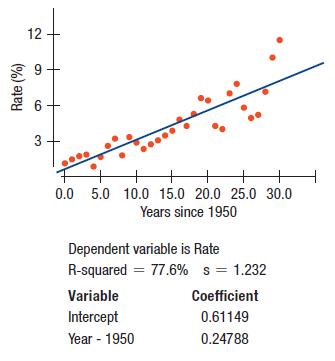
Step by Step Answer:
a Treasure bill rates peaked around 1980 and decreased afterward This regression mod...View the full answer


Intro Stats
ISBN: 9780134668420
5th Edition
Authors: Richard D De Veaux, Paul F Velleman, David E Bock, Nick Horton
