

Exercise 17 looked at the distribution of protein in the Burger King menu items, comparing meat and
Question:
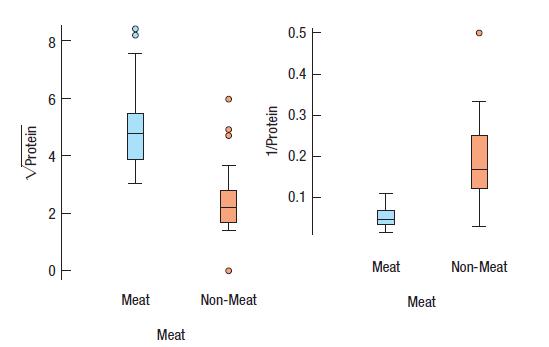
Exercise 17 looked at the distribution of protein in the Burger King menu items, comparing meat and non-meat items. That exercise offered the logarithm as a re-expression of Protein. Here are two other alternatives, the square root and the reciprocal. Would you still prefer the log.
Data From Exercise 17
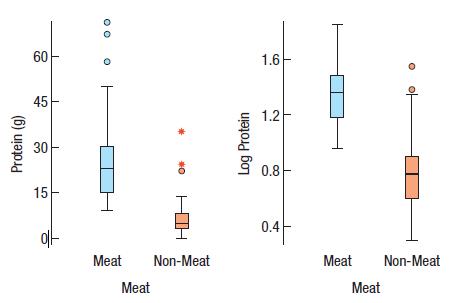
Recall the data about the Burger King menu items in Chapter 7. Here are boxplots of protein content comparing items that contain meat with those that do not. The plot on the right graphs log(Protein). Which of the goals of re-expression does this illustrate?
Fantastic news! We've Found the answer you've been seeking!
Step by Step Answer:
The log reexpression is still p...View the full answer

Answered By
Mugdha Sisodiya
My self Mugdha Sisodiya from Chhattisgarh India. I have completed my Bachelors degree in 2015 and My Master in Commerce degree in 2016. I am having expertise in Management, Cost and Finance Accounts. Further I have completed my Chartered Accountant and working as a Professional.
Since 2012 I am providing home tutions.
2+ Reviews
10+ Question Solved
Related Book For 

Intro Stats
ISBN: 9780134668420
5th Edition
Authors: Richard D De Veaux, Paul F Velleman, David E Bock, Nick Horton
Question Posted:
