

Question: Test scores from a calculus section of 40 students are shown in the histogram below. Describe the distribution of scores. Why might you be less
Test scores from a calculus section of 40 students are shown in the histogram below.
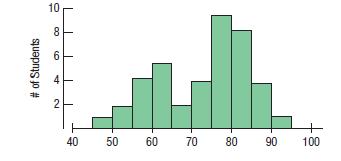
Describe the distribution of scores. Why might you be less sure of the description of the shape as compared to the histogram in Exercise 51?
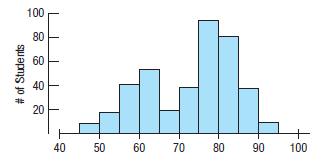
Data From Exercise 51
Test scores from a large calculus class of 400 are shown in the histogram below.
# of Students 10 8 6 4 2 40 Th 50 60 70 80 90 100
Step by Step Solution
★★★★★
3.34 Rating (166 Votes )
There are 3 Steps involved in it
1 Expert Approved Answer
Step: 1 Unlock

Solution The distribution of scores from above entails two hal... View full answer
Question Has Been Solved by an Expert!
Get step-by-step solutions from verified subject matter experts
Step: 2 Unlock
Step: 3 Unlock