

Question: Test scores Three statistics classes all took the same test. Histograms and boxplots of the scores for each class are shown below. Match each class
Test scores Three statistics classes all took the same test.
Histograms and boxplots of the scores for each class are shown below. Match each class with the corresponding boxplot.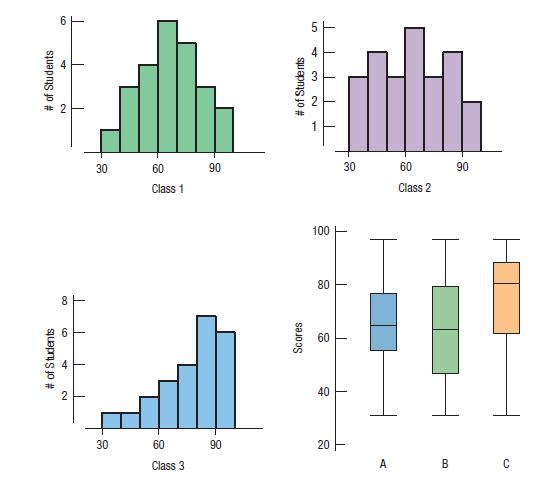
9 # of Students 4 2 8 # of Students 6 2 30 30 60 Class 1 90 30 # of Students + 3 2 30 30 60 Class 2 100- Scores 80 80 60 40 60 g. 90 20 Class 3 A 90 90 B C
Step by Step Solution
There are 3 Steps involved in it
1 Expert Approved Answer
Step: 1 Unlock

Question Has Been Solved by an Expert!
Get step-by-step solutions from verified subject matter experts
Step: 2 Unlock
Step: 3 Unlock