

Question: Test scores. Three Statistics classes all took the same test. Histograms of the scores for each class are shown below a) Which class had the
Test scores. Three Statistics classes all took the same test.
Histograms of the scores for each class are shown below
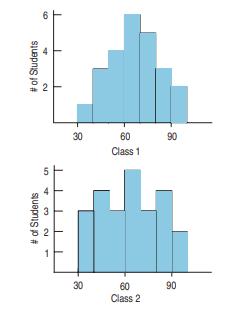
a) Which class had the highest mean score?
b) Which class had the highest median score?
c) For which class are the mean and median most different? Which is higher? Why?
d) Which class had the smallest standard deviation?
e) Which class had the smallest IQR?
# of Students # of Students 2 5 43 2 30 60 Class 1 90 30 60 Class 2 90
Step by Step Solution
There are 3 Steps involved in it
1 Expert Approved Answer
Step: 1 Unlock

Question Has Been Solved by an Expert!
Get step-by-step solutions from verified subject matter experts
Step: 2 Unlock
Step: 3 Unlock