

The Glassdoor Economic Research Blog published the compensation (in millions of dollars) for the CEOs of large
Question:
The Glassdoor Economic Research Blog published the compensation (in millions of dollars) for the CEOs of large companies. The distribution looks like this:
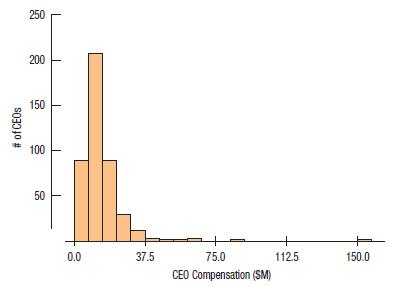
The mean CEO compensation is $14.1M and the standard deviation is $11.32M.
a) According to the Normal model, what percent of CEOs would you expect to earn more than 2 standard deviations above the mean compensation?
b) Is that percentage appropriate for these data?
Suppose we draw samples from the data and calculate the mean of each sample. How would we expect the means to vary? Here is a histogram of 1000 samples of 30 drawn from the CEOs:
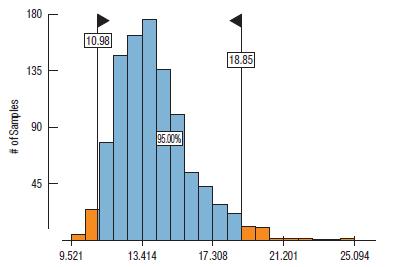
c) The standard deviation of these means is 2.0. The middle 95% of the means is colored in the histogram. Do you think the 68–95–99.7 Rule applies?
Suppose we draw samples of 100 instead. Now the histogram of means looks like this:
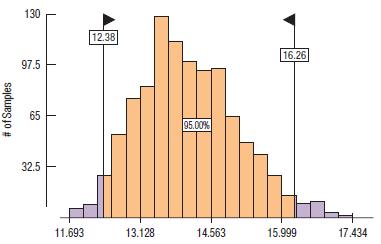
d) The standard deviation of these means is 1.0. Do you think the 68–95–99.7 Rule applies?
Once more, but this time with samples of 200:
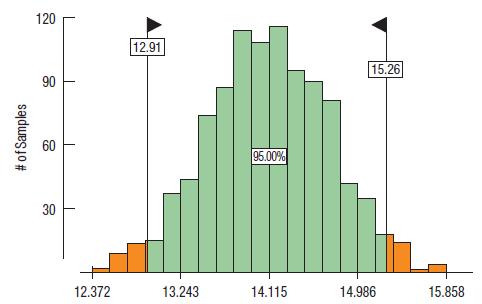
e) The standard deviation of these means is 0.60. Does the 68–95–99.7 Rule give a good idea of the middle 95% of the distribution?
Step by Step Answer:
a According to the Normal model about 25 of CEOs would be expected to e...View the full answer


Intro Stats
ISBN: 9780134668420
5th Edition
Authors: Richard D De Veaux, Paul F Velleman, David E Bock, Nick Horton
