

The scatterplot shows the gross domestic product (GDP) of the United States in trillions of 2009 dollars
Question:
The scatterplot shows the gross domestic product (GDP) of the United States in trillions of 2009 dollars plotted against years since 1950.

A linear model fit to the relationship looks like this:
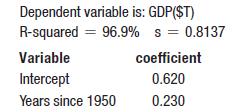
a) Does the value 96.9% suggest that this is a good model?
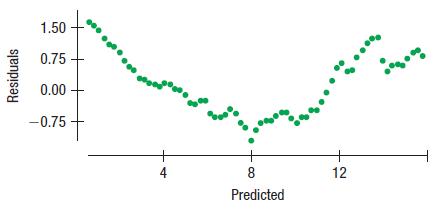
b) Here’s a scatterplot of the residuals. Now do you think this is a good model for these data?
Fantastic news! We've Found the answer you've been seeking!
Step by Step Answer:
a Although nearly 97 of the variation in GDP can ...View the full answer

Answered By
BETHUEL RUTTO
Hi! I am a Journalism and Mass Communication graduate; I have written many academic essays, including argumentative essays, research papers, and literary analysis. I have also proofread and written reviews, summaries and analyses on already finished works. I am eager to continue writing!
1+ Reviews
10+ Question Solved
Related Book For 

Intro Stats
ISBN: 9780134668420
5th Edition
Authors: Richard D De Veaux, Paul F Velleman, David E Bock, Nick Horton
Question Posted:
