

Question: Tracking hurricanes 2007. In a previous chapter, we saw data on the errors (in nautical miles) made by the National Hurricane Center in predicting the
Tracking hurricanes 2007. In a previous chapter, we saw data on the errors (in nautical miles) made by the National Hurricane Center in predicting the path of hurricanes.
The scatterplot shows the trend in the 24-hour tracking errors since 1970 (www.nhc.noaa.gov).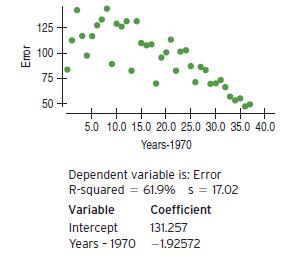
a) Interpret the slope and intercept of the model.
b) Interpret in this context.
c) The Center had a stated goal of achieving an average tracking error of 125 nautical miles in 2009. Will they make it? Why do you think so?
d) What if their goal were an average tracking error of 90 nautical miles?
e) What cautions would you state about your conclusion?
125 100 75 50+ + + 5.0 10.0 15.0 20.0 25.0 30.0 35.0 40.0 Years-1970 Dependent variable is: Error R-squared = 61.9% s = 17.02 Variable Coefficient Intercept 131.257 Years 1970 -1.92572
Step by Step Solution
There are 3 Steps involved in it

Get step-by-step solutions from verified subject matter experts