

Below is nine months return data for Walgreens and the S&P 500. a. Estimate the intercept (alpha)
Question:
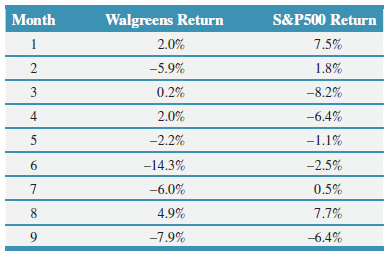
Below is nine months’ return data for Walgreens and the S&P 500.
a. Estimate the intercept (alpha) and beta for Walgreens stock using spreadsheet functions.
b. Interpret what the slope estimate means to a stock analyst.
c. Compute the R-squared of the regression using Excel’s RSQ function. What does the R-squared tell us about the relationship between Walgreens’ returns and those of the market?
Fantastic news! We've Found the answer you've been seeking!
Step by Step Answer:
a Alpha 2754 Beta 0340 R squared 0107 Interpret what the slope ...View the full answer

Answered By
Muhammad Umair
I have done job as Embedded System Engineer for just four months but after it i have decided to open my own lab and to work on projects that i can launch my own product in market. I work on different softwares like Proteus, Mikroc to program Embedded Systems. My basic work is on Embedded Systems. I have skills in Autocad, Proteus, C++, C programming and i love to share these skills to other to enhance my knowledge too.
1+ Reviews
10+ Question Solved
Related Book For 

Introduction to Finance Markets, Investments and Financial Management
ISBN: 978-1119398288
16th edition
Authors: Ronald W. Melicher, Edgar A. Norton
Question Posted:
