

Question: For the data given in Problem 3: a. Plot the scaled frequency histogram. b. Compute the mean and standard deviation, and use them to estimate
For the data given in Problem 3:
a. Plot the scaled frequency histogram.
b. Compute the mean and standard deviation, and use them to estimate the lower and upper limits of breaking force corresponding to 68 and 96 percent of cord pieces of this type. Compare these limits with those of the data.
Problem 3
The following list gives the measured breaking force in newtons for a sample of 60 pieces of certain type of cord. Plot the absolute frequency histogram. Try bin widths of 10, 30, and 50 N. Which gives the most meaningful histogram? Try to find a better value for the bin width.
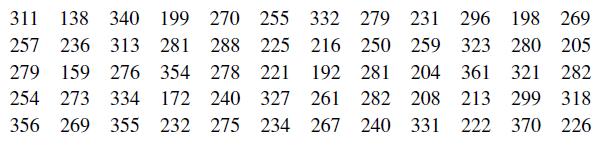
311 138 340 199 270 255 332 279 231 296 198 269 257 236 313 281 288 225 216 250 259 323 280 205 279 159 276 354 278 221 192 281 204 361 321 282 254 273 334 172 240 327 261 282 208 213 299 318 356 269 355 232 275 234 267 240 331 222 370 226
Step by Step Solution
3.40 Rating (162 Votes )
There are 3 Steps involved in it
To address this problem well first compute the scaled frequency histogram using the given data Then well calculate the mean and standard deviation to ... View full answer

Get step-by-step solutions from verified subject matter experts