

Question: For the data given in Problem 1: a. Plot the scaled frequency histogram. b. Compute the mean and standard deviation and use them to estimate
For the data given in Problem 1:
a. Plot the scaled frequency histogram.
b. Compute the mean and standard deviation and use them to estimate the lower and upper limits of gas mileage corresponding to 68 percent of cars of this model. Compare these limits with those of the data.
Problem 1
The following list gives the measured gas mileage in miles per gallon for 22 cars of the same model. Plot the absolute frequency histogram and the relative frequency histogram.
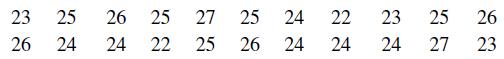
23 25 26 25 27 25 24 22 23 25 26 26 24 24 22 25 26 24 24 24 27 23
Step by Step Solution
3.30 Rating (168 Votes )
There are 3 Steps involved in it
a To plot the scaled frequency histogram we need to calculate the absolute frequency and relative fr... View full answer

Get step-by-step solutions from verified subject matter experts