

Question: For the data given in Problem 2: a. Plot the scaled frequency histogram. b. Compute the mean and standard deviation and use them to estimate
For the data given in Problem 2:
a. Plot the scaled frequency histogram.
b. Compute the mean and standard deviation and use them to estimate the lower and upper limits of strength corresponding to 68 and 96 percent of such timber pieces. Compare these limits with those of the data.
Problem 2
Thirty pieces of structural timber of the same dimensions were subjected to an increasing lateral force until they broke. The measured force in pounds required to break them is given in the following list. Plot the absolute frequency histogram. Try bin widths of 50, 100, and 200 lb. Which gives the most meaningful histogram? Try to find a better value for the bin width.
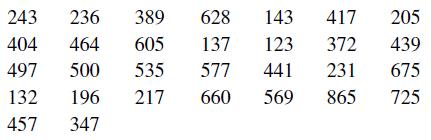
243 236 389 628 143 417 205 404 464 605 137 123 372 439 497 500 535 577 441 231 675 132 196 217 660 569 865 725 457 347
Step by Step Solution
3.42 Rating (171 Votes )
There are 3 Steps involved in it
a To plot the scaled frequency histogram in MATLAB we can use the histogram function with the Normalization option set to probability Heres the code t... View full answer

Get step-by-step solutions from verified subject matter experts