

Question: A regression table is shown based on data used to test an association between the amount of sleep someone had the previous night (in hours)
a. What is the regression equation where time to complete the maze is predicted from the amount of sleep?
b. If we were testing against the alternative hypothesis β ‰ 0, what is the p-value?
c. If we were testing against the alternative hypothesis β < 0, what is the p-value?
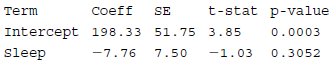
t-stat p-value Coeff Term SE Intercept 198.33 51.75 3.85 0.0003 -1.03 0.3052 Sleep -7.76 7.50
Step by Step Solution
★★★★★
3.37 Rating (156 Votes )
There are 3 Steps involved in it
1 Expert Approved Answer
Step: 1 Unlock

a Predicted t... View full answer
Question Has Been Solved by an Expert!
Get step-by-step solutions from verified subject matter experts
Step: 2 Unlock
Step: 3 Unlock