

Question: Refer to the data in Exercise 12.7. The normal probability plot and the residuals versus fitted values plots generated by MINITAB are shown here. Does
Refer to the data in Exercise 12.7. The normal probability plot and the residuals versus fitted values plots generated by MINITAB are shown here. Does it appear that any regression assumptions have been violated? Explain.
MINITAB output for Exercise 12.31
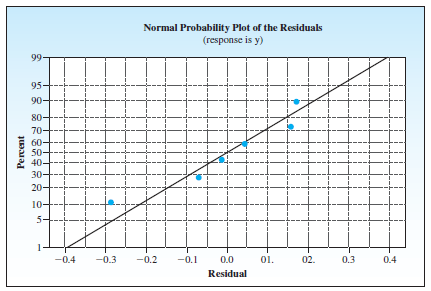
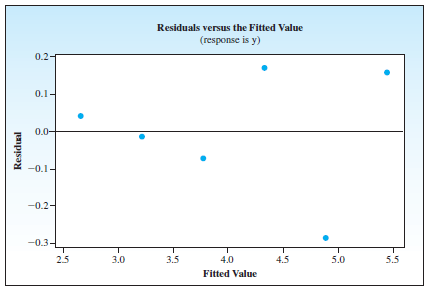
Normal Probability Plot of the Residuals (response is y) 99 95 90- 80- 70- 60 50- 40- 30- 20- 10 01. -0.4 -0.3 -0.2 -0.1 0.0 02. 0.3 0.4 Residual Percent Residuals versus the Fitted Value (response is y) 0.2- 0.1- 0.0- -0.1- -0.2- -0.3- 2.5 3.0 3.5 4.0 4.5 5.0 5.5 Fitted Value jempisa
Step by Step Solution
3.38 Rating (164 Votes )
There are 3 Steps involved in it
Although there is one data po... View full answer

Get step-by-step solutions from verified subject matter experts