

Question: 4. The normal probability plot and the residuals versus fitted values were generated using the MINITAB regression analysis program for the data that follow (
4. The normal probability plot and the residuals versus fitted values were generated using the MINITAB regression analysis program for the data that follow
(
Exercise 18, Section 12.1).
![]()
Does it appear that any regression assumptions have been violated? Explain.
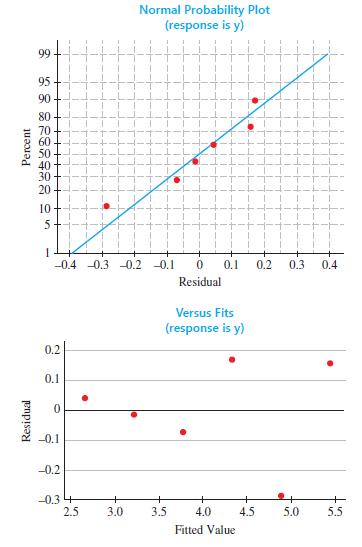
x 1 2 2 3 4 5 6 y 5.6 4.6 4.5 3.7 3.2 2.7
Step by Step Solution
There are 3 Steps involved in it
1 Expert Approved Answer
Step: 1 Unlock

Question Has Been Solved by an Expert!
Get step-by-step solutions from verified subject matter experts
Step: 2 Unlock
Step: 3 Unlock