

The following segmented bar graph was produced from data collected in the 2010 General Social Survey with
Question:
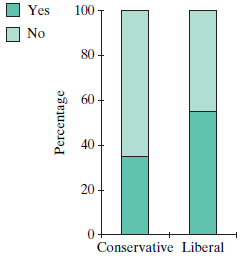
a. About what proportion of the liberals responded that people can be trusted?
b. About what proportion of the conservatives responded that people can be trusted?
c. Does the graph provide any information about what proportion of respondents were liberals?
d. Does the graph suggest that there is a relationship between political leanings and trust? Explain.
Fantastic news! We've Found the answer you've been seeking!
Step by Step Answer:
a 52 b 35 ...View the full answer

Answered By
Kalyan M. Ranwa
I have more than seven years of teaching experience in physics and mechanical engineering.
1+ Reviews
10+ Question Solved
Related Book For 

Introduction To Statistical Investigations
ISBN: 9781118172148
1st Edition
Authors: Beth L.Chance, George W.Cobb, Allan J.Rossman Nathan Tintle, Todd Swanson Soma Roy
Question Posted:
