

The General Social Survey asked a random sample of adult Americans about their political viewpoint and also
Question:
The sample results for the 2012 survey are organized in the following two-way table of counts:
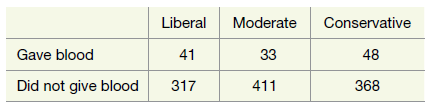
a. For each political viewpoint, determine the sample proportion who claimed to have given blood in the past year.
b. Calculate the value of the MAD statistic for these sample data.
c. Express the null hypothesis to be tested with these data.
d. Conduct a simulation-based analysis of these data based on the MAD statistic. Submit a screen capture of the null distribution and shade the area in the null distribution that corresponds to the p-value.
e. Report the p-value from the simulation analysis. Also write a sentence interpreting what this p value represents (probability of what, assuming what?).
f. At the 0.05 significance level, do the sample proportions who gave blood differ enough among the three political groups to consider the observed association to be statistically significant? Explain how you determine the answer.
DistributionThe word "distribution" has several meanings in the financial world, most of them pertaining to the payment of assets from a fund, account, or individual security to an investor or beneficiary. Retirement account distributions are among the most...
Step by Step Answer:
a Liberal 0115 moderate 0074 conservative 0115 b MAD 0027 c Null ...View the full answer


Introduction To Statistical Investigations
ISBN: 9781118172148
1st Edition
Authors: Beth L.Chance, George W.Cobb, Allan J.Rossman Nathan Tintle, Todd Swanson Soma Roy
