

After fitting the two-parameter Margules equation to the data below, generate a P-x-y diagram at 78.15 C.
Question:
After fitting the two-parameter Margules equation to the data below, generate a P-x-y diagram at 78.15 °C.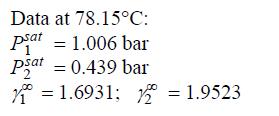
Fantastic news! We've Found the answer you've been seeking!
Step by Step Answer:
To generate a Pxy diagram at 7815C after fitting the twoparameter Margules equation to the given dat...View the full answer

Answered By
Surojit Das
I have vast knowledge in the field of Mathematics, Business Management and Marketing. Besides, I have been teaching on the topics Management leadership, Business Administration, Human Resource Management, Business Communication, Accounting, Auditing, Organizer Behaviours, Business Writing, Essay Writing, Copy Writing, Blog Writing since 2020. It is my personality to act quickly in any emergency situations when students need my services. I am very professional and serious in every questions students asked me at the time of dealing any projects. I have been serving detailed, quality, properly analysed research paper through the years.
91+ Reviews
278+ Question Solved
Related Book For 
Introductory Chemical Engineering Thermodynamics
ISBN: 9780136068549
2nd Edition
Authors: J. Elliott, Carl Lira
Question Posted:
