

Molecular simulation can be used to explore the accuracy and significance of individual contributions to an equation
Question:
Molecular simulation can be used to explore the accuracy and significance of individual contributions to an equation of state. Use the DMD module at Etomica.org to explore Xe’s energy departure.
(a) The simulation results below have been tabulated at ηP = 0.167, λ = 1.7. Plot U/NAε versus βε for these data along with those at ηP = 0.375 from homework problem 7.25.
(b) Prepare a plot of Xe’s simulated U – Uig versus 1000/T using your best ε and σ at ηP = 0.375 and showing the isochoric data for Xe from Webbook.nist.gov at 22.14 mol/L on the same axes.
(c) The data for U-Uig exhibit a linear trend with βε. The data for Z also exhibit a linear trend with βε. What trends do these two data sets indicate for (A – Aig)TV/RT? Are they consistent? Explain.
(d) Use the trapezoidal rule and the energy equation (Eqn. 7.49) to estimate A – Aig and plot as a dashed line. How accurate are your estimates (AAD%) and how could you improve them?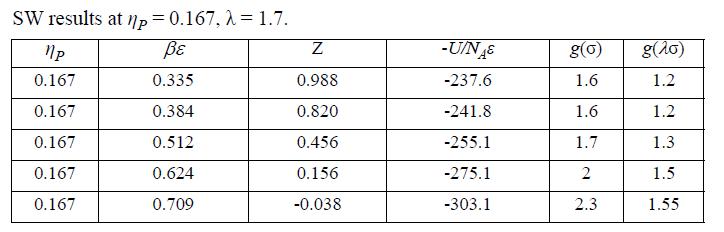
Data from problem 7.25
Molecular simulation can be used to explore the accuracy and significance of individual contributions to an equation of state. Use the DMD module at Etomica.org to tune Xe’s ε and σ parameters.
(a) According to the Carnahan-Starling (CS) model, what value do you obtain for ZHS at ηP=0.375?
(b) What value of σ corresponds to ηP = 0.375 for Xe at 22.14 mol/L?
(c) The simulation results below have been tabulated at ηP = 0.375, λ = 1.7. Plot Z versus βε for these data. Referring to the NIST WebBook for Xe, estimate the saturation T and Z at 22.14 mol/L. Estimate the value of βε that corresponds to the saturation Z. Estimate the value of ε(J/mol).
(d) Plot Z versus 1000/T, using your best ε and σ at ηP = 0.375 and showing the fluid properties (isochoric) data from WebBook.nist.gov at 22.14 mol/L on the same axes.
(e) What values of a and b of the vdW EOS will match the simulation data of this plot? Show the vdW results as a dashed line on the plot.
(f) Using the values of ε and σ from parts (b) and (c), simulate the system at 225 K and 20.0 mol/L for ~400 ps (got pizza?). Use the CS equation to estimate the y-intercept value for Z and connect the dots on a new plot with a straight line extrapolating through the x-axis. Plot the NIST data for this isochore on the same axes. This represents a prediction of the data at 20.0 mol/L since the parameters were determined at other conditions.
(g) Using the values of a and b from part (e), plot the vdW results at 20.0 mol/L as a dashed line on the plot. This represents the vdW prediction. Comment critically.
(h) Compare to Problem 7.24. Summarize your observations. SW results at ηP = 0.375, λ = 1.7.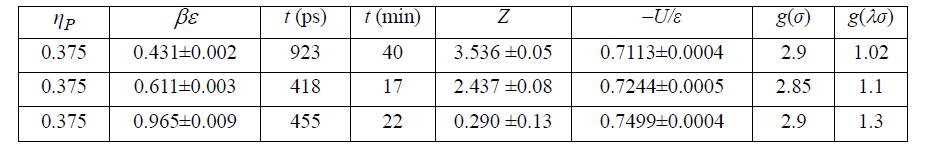
Data from Problem 7.24
Molecular simulation can be used to explore the accuracy and significance of individual contributions to an equation of state. Here we explore how the σ parameter relates to experimental data.
Erpenbeck and Wood have reported precise simulation results for hard spheres as listed below. Plot these data and compare the ESD and Carnahan-Starling (CS) equations for hard spheres.
According to the CS equation, what value do you obtain for ZHS at ηP=0.392?
What value of b corresponds to ηP = 0.392 for Xenon at 22.14 mol/L? What value of σ corresponds to that value of b?
The simulation results below have been tabulated at ηP = 0.392. Plot Z versus βε for these data. Estimate the value of βε that corresponds to the saturation temperature.
Referring to Xenon on the NIST WebBook, estimate the saturation temperature at 22.14mol/L. Referring to part (d) for the value of βε, estimate the value of ε(J/mol).
Plot Z versus 1000/T for the simulation data using your best ε and σ at ηP = 0.392. Referring to the “fluid properties” link, plot the isochoric data for Xenon from the NIST WebBook at 22.14mol/L on the same axes.
What values of a and b of the vdW EOS match the simulation data of this plot? Compute Zvdw versus 1000/T and show the vdW results as a dashed line on the plot.
Using the values of ε and σ from parts (c) and (e), simulate the system “isothermally” at 225 K and 20.0 mol/L for ~400 ps (got pizza?). Use the CS equation to estimate the yintercept for Z. Plot these points including a trendline with equation. Plot the NIST data for this isochore on the same axes. This represents a prediction of the data at 20.0 mol/ L since the parameters were determined at other conditions.
Using the values of a and b from part (g), plot the vdW results at 20.0 mol/L as a dashed line on the plot. This represents the vdW prediction.
Which model (SW or vdW) matches the experimental trend best? Why?
Neither prediction is perfect. Suggest ways that we may proceed to improve the predictions further.
Step by Step Answer:

This question has not been answered yet.
You can Ask your question!

Introductory Chemical Engineering Thermodynamics
ISBN: 9780136068549
2nd Edition
Authors: J. Elliott, Carl Lira
