

Question: Using the data from problem 11.27, fit the specified model equation and then plot the P-x-y diagram at 80C using the (a) Wilson equation (b)
Using the data from problem 11.27, fit the specified model equation and then plot the P-x-y diagram at 80°C using the
(a) Wilson equation
(b) NRTL equation
(c) UNIQUAC equation
Data from problem 11.27
VLE data for the system carbon tetrachloride(1) and 1,2-dichloroethane(2) are given below at 760 mmHg, as taken from the literature.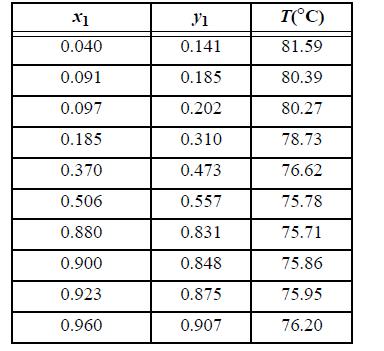
Fit the data to the one-parameter Margules equation.
Fit the data to the two-parameter Margules equation.
Plot the P-x-y diagram at 80°C, based on one of the fits from (a) or (b).
X1 0.040 0.091 0.097 0.185 0.370 0.506 0.880 0.900 0.923 0.960 V1 0.141 0.185 0.202 0.310 0.473 0.557 0.831 0.848 0.875 0.907 T(C) 81.59 80.39 80.27 78.73 76.62 75.78 75.71 75.86 75.95 76.20
Step by Step Solution
3.51 Rating (161 Votes )
There are 3 Steps involved in it

Get step-by-step solutions from verified subject matter experts