

Fit the data from problem 11.27 to the following model by regression over all points, and compare
Question:
Fit the data from problem 11.27 to the following model by regression over all points, and compare with the experimental data on the same plot, using
(a) – (e) as in problem 12.8.
Data from problem 11.27
VLE data for the system carbon tetrachloride(1) and 1,2- dichloroethane(2) are given below at 760 mmHg, as taken from the literature.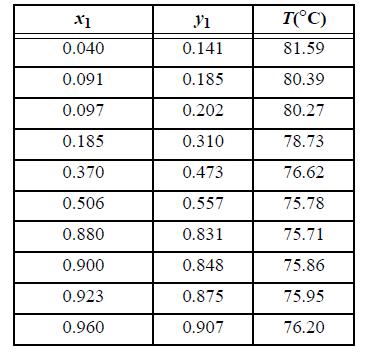
Data from problem 12.8
Fit the data from problem 11.11 to the following model by regression over all points, and compare with the experimental data on the same plot, using
(a) The Scatchard-Hildebrand model with k12 = 0
(b) The SSCED model with a default value of k12
(c) The SSCED model with k12 matched to the data
(d) The van Laar equation
(e) Plot the P-x-y diagram at 80°C, based on the fits specified by your instructor.
Data from problem 11.11:
Fit the Margules two-parameter equation to the n-pentane(1) + acetone(2) system P-x-y data below at 1 bar (Lo et al. 1962. J. Chem. Eng. Data 7:32) by fitting to x1 = 0.503. Plot the resultant fit together with the original data for both phases.
Compare the data with the predictions of the MAB model.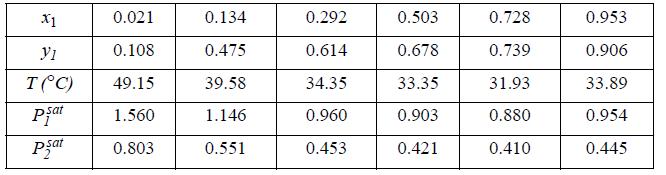
Step by Step Answer:

This question has not been answered yet.
You can Ask your question!


Introductory Chemical Engineering Thermodynamics
ISBN: 9780136068549
2nd Edition
Authors: J. Elliott, Carl Lira
