

Question: 3.13 The value of a quantitative variable is measured once a year for a 10-year period: a. Draw a scatterplot to describe the variable as
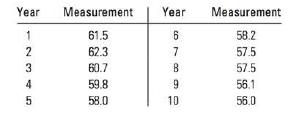
3.13 The value of a quantitative variable is measured once a year for a 10-year period:
a. Draw a scatterplot to describe the variable as it changes over time.
b. Describe the measurements using the graph constructed in part
a. c. Use this MINITAB output to calculate the correla- tion coefficient, r:
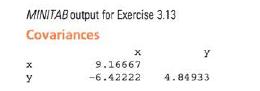
d. Find the best-fitting line using the results of part
c. Verify your answer using the data entry method in your calculator.
e. Plot the best-fitting line on your scatterplot from part
a. Describe the fit of the line.
Year Measurement Year Measurement 12345 61.5 6 58.2 62.3 7 57.5 60.7 8 57.5 59.8 9 56.1 58.0 10 56.0
Step by Step Solution
There are 3 Steps involved in it

Get step-by-step solutions from verified subject matter experts