

Question: 14. Measuring over Time A quantitative variable is measured once a year for a 10-year period. What does the line chart tell you about the
14. Measuring over Time A quantitative variable is measured once a year for a 10-year period. What does the line chart tell you about the data?
Construct a line chart to describe the data
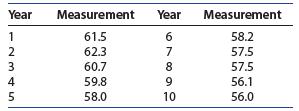
Year Measurement Year Measurement 1 61.5 6 58.2 2 62.3 7 57.5 3 60.7 8 57.5 4 59.8 9 56.1 5 58.0 10 56.0
Step by Step Solution
There are 3 Steps involved in it
1 Expert Approved Answer
Step: 1 Unlock

Question Has Been Solved by an Expert!
Get step-by-step solutions from verified subject matter experts
Step: 2 Unlock
Step: 3 Unlock