

Question: 19. Measuring Over Time A quantitative variable is measured once a year for a 10-year period: a. Draw a scatterplot to describe the variable as
19. Measuring Over Time A quantitative variable is measured once a year for a 10-year period:
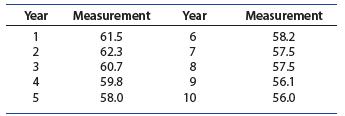
a. Draw a scatterplot to describe the variable as it changes over time.
b. Describe the measurements using the graph constructed in part a.
c. Use this MINITAB output to calculate the correlation coefficient, r:
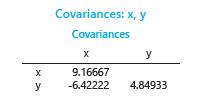
d. Find the best-fitting line using the results of part c.
Verify your answer using the data entry method in your calculator.
e. Plot the best-fitting line on your scatterplot from part a.
Describe the fit of the line.
Year Measurement Year Measurement 12345 61.5 6 58.2 62.3 7 57.5 60.7 8 57.5 59.8 9 56.1 58.0 10 56.0
Step by Step Solution
There are 3 Steps involved in it

Get step-by-step solutions from verified subject matter experts