

Question: Convert the distribution obtained in Exercise 2.12 into a cumulative less than distribution and plot its ogive. Data From Exercise 2.12 2.12 The following are
Convert the distribution obtained in Exercise 2.12 into a cumulative "less than" distribution and plot its ogive.
Data From Exercise 2.12
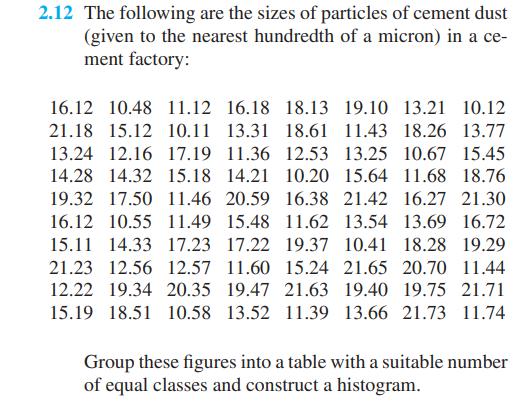
2.12 The following are the sizes of particles of cement dust (given to the nearest hundredth of a micron) in a ce- ment factory: 16.12 10.48 11.12 16.18 18.13 19.10 13.21 10.12 21.18 15.12 10.11 13.31 18.61 11.43 18.26 13.77 13.24 12.16 17.19 11.36 12.53 13.25 10.67 15.45 14.28 14.32 15.18 14.21 10.20 15.64 11.68 18.76 19.32 17.50 11.46 20.59 16.38 21.42 16.27 21.30 16.12 10.55 11.49 15.48 11.62 13.54 13.69 16.72 15.11 14.33 17.23 17.22 19.37 10.41 18.28 19.29 21.23 12.56 12.57 11.60 15.24 21.65 20.70 11.44 12.22 19.34 20.35 19.47 21.63 19.40 19.75 21.71 15.19 18.51 10.58 13.52 11.39 13.66 21.73 11.74 Group these figures into a table with a suitable number of equal classes and construct a histogram.
Step by Step Solution
There are 3 Steps involved in it

Get step-by-step solutions from verified subject matter experts