

An engineer uses a thermocouple to monitor the temperature of a stable reaction. The ordered values of
Question:
An engineer uses a thermocouple to monitor the temperature of a stable reaction. The ordered values of 50 observations (Courtesy of Scott Sanders), in tenths of ${ }^{\circ} \mathrm{C}$, are
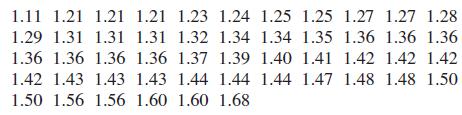
Group these figures into a distribution having the classes $1.10-1.19,1.20-1.29,1.30-1.39, \ldots$, and $1.60-1.69$, and plot a histogram using $[1.10,1.20), \ldots$,
${ }^{2}$ H. Qin, H. Kim, and R. Blick, Nanotechnology 19 (2008), 095504. (5pp) $[1.60,1.70)$, where the left-hand endpoint is included but the right-hand endpoint is not.
Step by Step Answer:

This question has not been answered yet.
You can Ask your question!
Related Book For 
Probability And Statistics For Engineers
ISBN: 9780134435688
9th Global Edition
Authors: Richard Johnson, Irwin Miller, John Freund
Question Posted:
