

Question: Convert the distribution obtained in Exercise 2.14 into a cumulative less than distribution and plot its ogive. Data From Exercise 2.14 2.14 An engineer uses
Convert the distribution obtained in Exercise 2.14 into a cumulative "less than" distribution and plot its ogive.
Data From Exercise 2.14
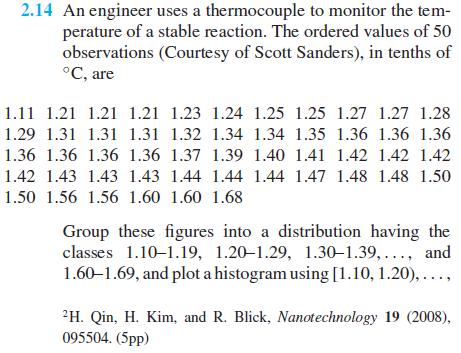
2.14 An engineer uses a thermocouple to monitor the tem- perature of a stable reaction. The ordered values of 50 observations (Courtesy of Scott Sanders), in tenths of C, are 1.11 1.21 1.21 1.21 1.23 1.24 1.25 1.25 1.27 1.27 1.28 1.29 1.31 1.31 1.31 1.32 1.34 1.34 1.35 1.36 1.36 1.36 1.36 1.36 1.36 1.36 1.37 1.39 1.40 1.41 1.42 1.42 1.42 1.42 1.43 1.43 1.43 1.44 1.44 1.44 1.47 1.48 1.48 1.50 1.50 1.56 1.56 1.60 1.60 1.68 Group these figures into a distribution having the classes 1.10-1.19, 1.20-1.29, 1.30-1.39,..., and 1.60-1.69, and plot a histogram using [1.10, 1.20),..., 2H. Qin, H. Kim, and R. Blick, Nanotechnology 19 (2008), 095504. (5pp)
Step by Step Solution
There are 3 Steps involved in it

Get step-by-step solutions from verified subject matter experts